Introduction
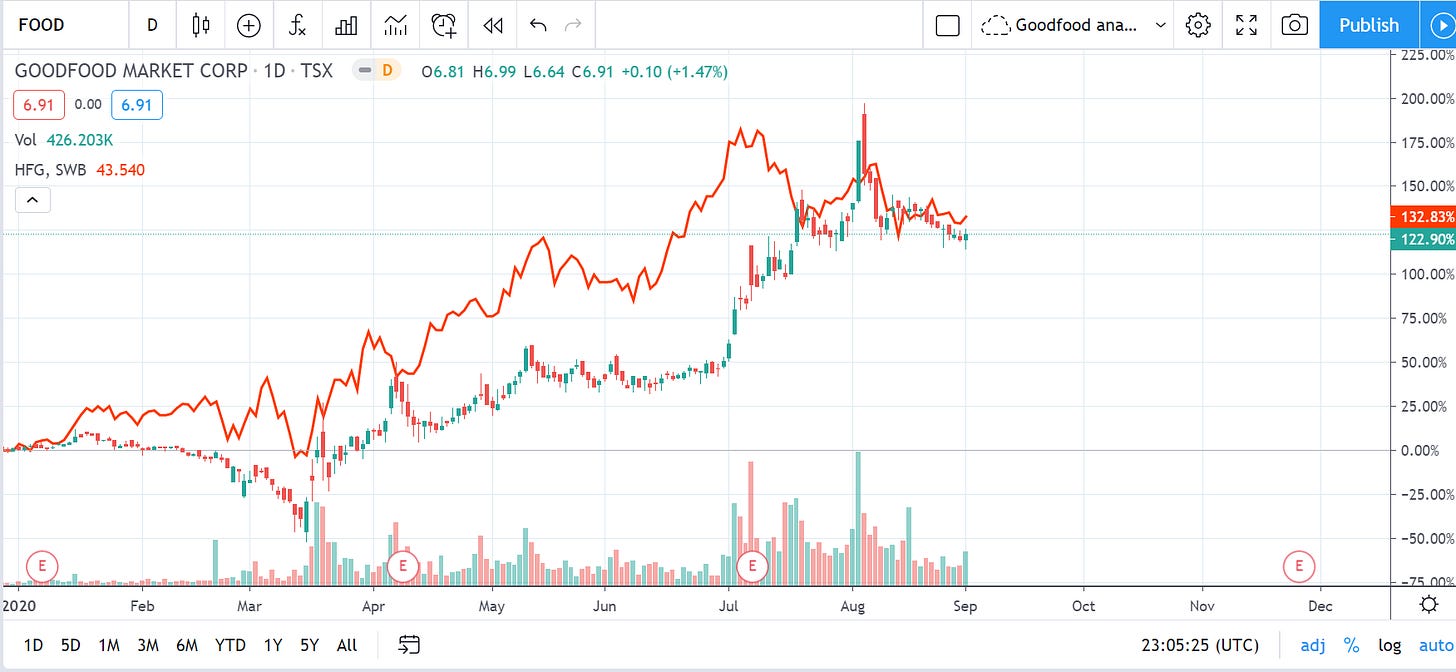
Goodfood is a Canadian meal kit company delivering fresh ingredients that simplifies the preparation of delicious meals at home for subscribers. The company grew 60 % Q-to-Q at Q2FY20 and 74% Q-to-Q at Q3FY20, while its stock market soared 130% YTD.
Founded in late 2014 by two former investment banking analysts in Montreal, the company began as a copycat company of worldwide category leader HelloFresh. The German company was the first to break down the door of the online meal kit industry. Today, it has reached an annualized revenue of 3.9B$ with almost 5 M active subscribers and a market cap of 8B$.
Hellofresh
Hellofresh built its growth strategy by picking quickly increasing it’s momentum, especially in the USA. Today, the company is present in 12 different countries and the revenue segments are parted in two : (1) International, which mainly comprises of European and common-wealth countries, and (2) the USA.
It took 3 years for HelloFresh to grow from 0.2M$ to 1B$ annualized revenues at 87% CAGR and then another 2 years to expand to 2.8B$ at +54% CAGR. The COVID-19 pandemic event provided a 39% quarter-to-quarter increase on an annualized basis.
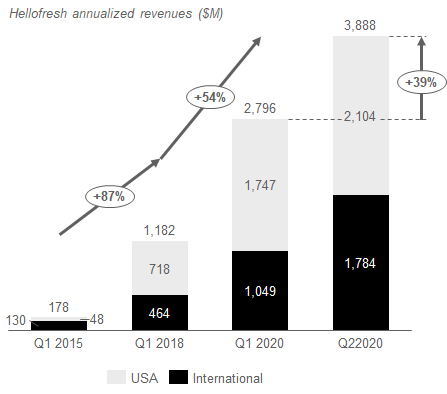
From Q1FY15 to Q4FY18, the proportion of American revenues went from 27% to 61%: 67% of the growth came from the USA segment.
From Q1FY18 to Q2FY20, the proportion of American revenues went from 67% to 54%: growth went from both segments equally.
To achieve this expotential growth, Hellofresh has been really agressive in marketing, with marketing costs during a long time around 27% of revenues , and acquired two companies : Chef green (US) and Chef’s Plate (CA) in Q1FY18.
At the same time, Hellofresh multiply it’s base of active customers by 6.5 during the 2015-2018 period and by x2.2 during the last two years.
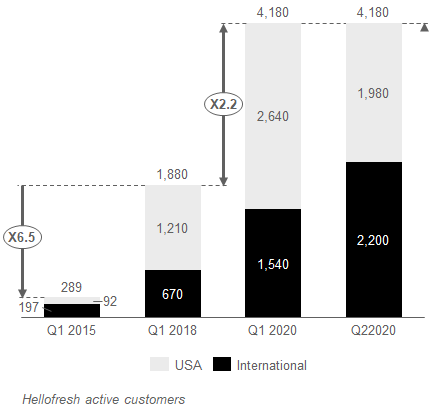
Hellofresh has an Average Revenu per Users (ARPU) really stable during it’s last five year , around 176 EUR per quarter.
We can also extract the following ratios from financials statements :
Average orders per customer over a quarter: 3,6
Average order value (in EUR) : 46,4 EUR
Average meals per order: 7.4
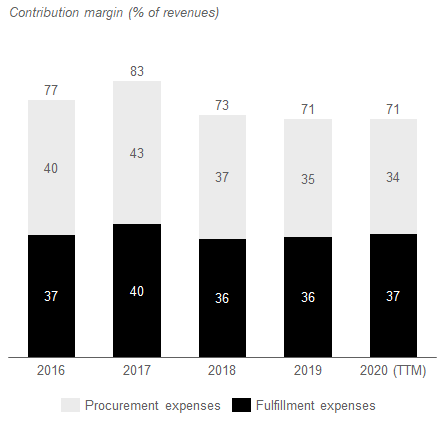
If we look at the cost of good sold, Hellofresh express this cost as contribution margin, which is the sum of procurement expenses and fulfillment expenses. As we can see on the graph below, gross margin is table around 27-29%.
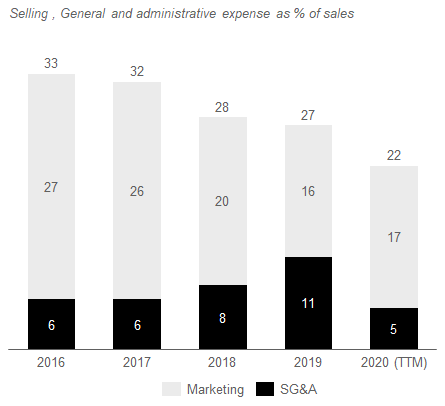
On the other cost line, S&GA expenses went down from 33% of revenues in 2016 to 22% in 2020 (TTM). The decrease is due to a decrease in marketing expenses at sales numbers equal.
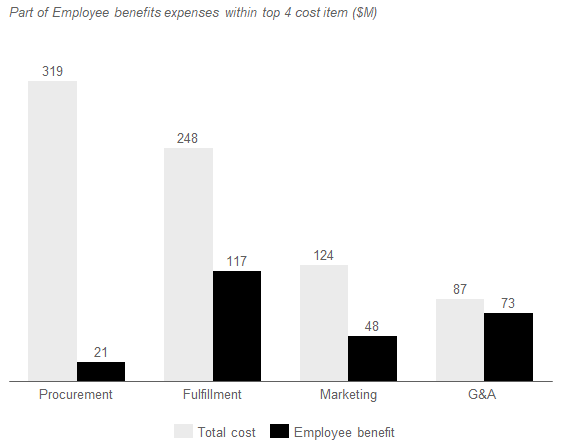
To have a better understanding of the costs, we can see below the distribution of employee benefits expenses among the 4 cost line item. Employee benefits expenses represent 47 % of fulfillment expenses, 40 % of marketing expenses and only 6.5% of procurement expenses.
GOODFOOD
The Canadian grocery market is estimated at 126B$. Due to a high concentration of the industry, Canada has the particularity that roughly only 1% of the market is online. This consumer behaviour is strikingly different from other western countries. For example, online grocery represents 4% of the grocery market in the UK and almost 11% in the US.
The situation could be explained by three factors:
1. Costly delivery solutions do not make online groceries cost-effective enough
2. Strong habits (on average, a Canadian consumer purchases groceries 2.5x/week)
3. Online shopping creates a difficulty to guarantee the quality of the product.
However, the online grocery industry was among the fastest-growing industries in Canada in the last five years.
It looks like consumer behaviour is changing and the pandemic is only accelerating this trend. GoodFood announced a quarter result of 86M$ for the months of March, April, and May 2020, up 30M$ (+53%) from last quarter. If the actual situation continues for months, we have good reason to believe that some changes in habits will become a permanent trend.
The lack of innovation in the online grocery market can also be viewed as a result of the high concentration in the industry. Damaging store networks in one way or another, the few key players of the industry have not been incentivized to push online sales.
The Canadian meal kit delivery market has seen a lot of players at its early stages: HelloFresh, Chef’s Plate, GoodFood, Chef Cook It, MissFresh, TruLocal, and LiveFit Foods, to name a few. However, over the years, the industry has consolidated. HelloFresh acquired Chef’s Plate, while Chef Cook It bought MissFresh and is owned at 70% by Metro Inc. Today, HelloFresh Canada and Goodfood (who created a value proposition with the brand Yumm) controls 80% of the market.
Goodfood’s strategy is built upon three pillars:
Strengthening its position in the meal kit delivery of Canadian market leader
Focus on the canadian online traditional grocery market
Building an efficient consumer grocery network around the country
Meal kit delivery: It’s a subscription box business; subscriptions are weekly and fresh ingredients are received, pre-portioned for consumers with specific recipes.
Online traditional grocery: Due to the opportunities offer by the canadian market, Goodfood chose to focus on its private label products instead of going international to build its growth. As an add-on of the box, you can now order among 100SKU’s of private-label products. Management would like to bring the offer at 4,000SKU’s (i.e 80% of the market) and consumer will be able to order it seperatly from the box.
Infrastructure’s network: Goodfood leases 550,000 sq ft of fulfillment centers within Canada: Montreal, Calgary, Great Vancouver, Great Toronto; it possesses the biggest distribution network. Similar to Amazon, by building highly automated distribution centers, and being closer to the consumer, GoodFood increases their gross profit margin, and they have the possibility to create a viable online delivery model – a difficult barrier to pass for Canadian consumers in the online grocery market. The announcement of GoodFood WOW reflects on Amazon’s concept “Prime”: a monthly subscription at 9$/mo to get a same-day/24 H delivery service.
Below are the annualized revenue from the last 5 years:
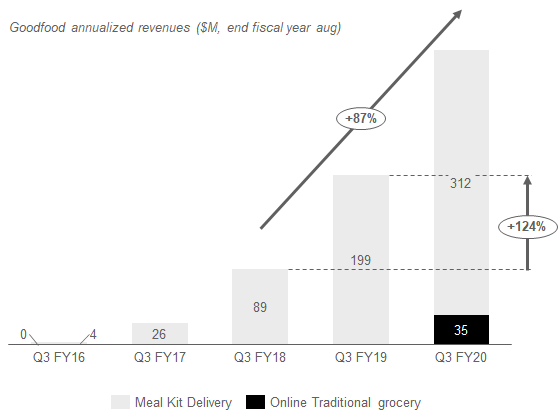
To achieve this growth, Goodfood went from 30 000 subscribers in Q3 FY17 tp 246 000 subscribers in Q3 FY19 and o projected 360 000 subscribers in Q3FY20. Base on these numbers, we calculte a quarterly ARPU of $240 by subcribers.
Before going trought the valuation of Goodfood, let’s go trought the costs item:
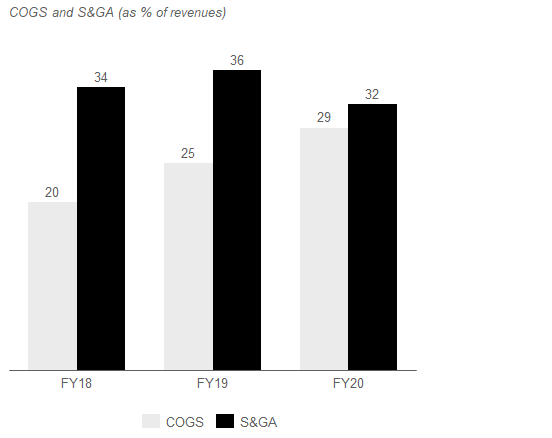
Goodfood does not disclose the costs distribution within it’s COGS expenses. Based on Hellofresh data, we could assume that the increase over the last three years is due to an increase on fulfillment expenses due to it’s growth and it’s new 550,000 sq ft of real restate.
Goodfood does not disclose the costs distribution , but we can assume that the decrease in S&GA expenses is due to a decrease in marketing expenses, mostly due to the last quarter and the COVID-19 pandemie.
GOODFOOD : FCF Valuation
As understood, if GoodFood operates in the meal kit delivery market presently, it aims to grow another segment by competing directly against traditional groceries – and Amazon – within the online traditional grocery market. I will take this into consideration in my valuation.
A. Breakdown of GoodFood’s meal kit revenues
We will use some references from HelloFresh’s business in order to breakdown Goodfood’s revenue.
On the graph below, I break down the price by meal and by box for Goodfood’s three most popular baskets. Keeping in mind that the average meals per order of HelloFresh was 7.4 , I built a distribution table that allows me to get as close at possible of this number.
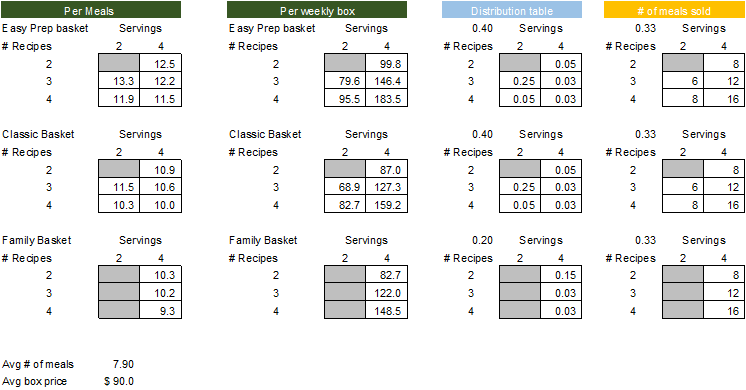
By doing so, we arrive at an average # of meals per order of 7.9 and an average box price of $90.0
B. Inputs of the model
The grocery industry in Canada was worth $124B in 2019 and experts estimated that roughly 0.8% of the industry was online. The online grocery industry can be divided in two segments: online traditional groceries and online Meal kit delivery. Within the FY19 annual report, Goodfood’s management publicy estimated that they control 40% of the meal kit market delivery with total sales of $161M during the year.
Last quarter, Q3 FY20, Goodfood earned earned a gross profit of 29% on revenues of 344M$ TTM. Net working capital was (-$30.7M) and depreciation $5.5M, 12% of gross PP&E. Working capital capital investment equals -8% in FY20 and -15% in FY19 of net sales. SG&A were 28% of net sales. Sales are expected to growth during the next 5 years based on assumptions around overall market growth, market penetration and segments performance. After five years, overall sales are expected to decline to a stable 1.2% per year. In FY20, goodfood gave on average 15% of incentive credits to promote their sales. The statutory tax rate is 26.6% and Goodfood has 59 100 000 common share, including the value of stock options plan. Total debt is equal to $68.9M and includes : $23.2M of convertible debentures, $24M of lease obligations, $12.6M of Long term debt and $9.1M of line of credits. Cost of debt is estimated at 5.53%. Beta (5Y Monthly) is 0.3. Market value of equity is 467M$ on Aug 12th 2020.
C. Assumptions of the model
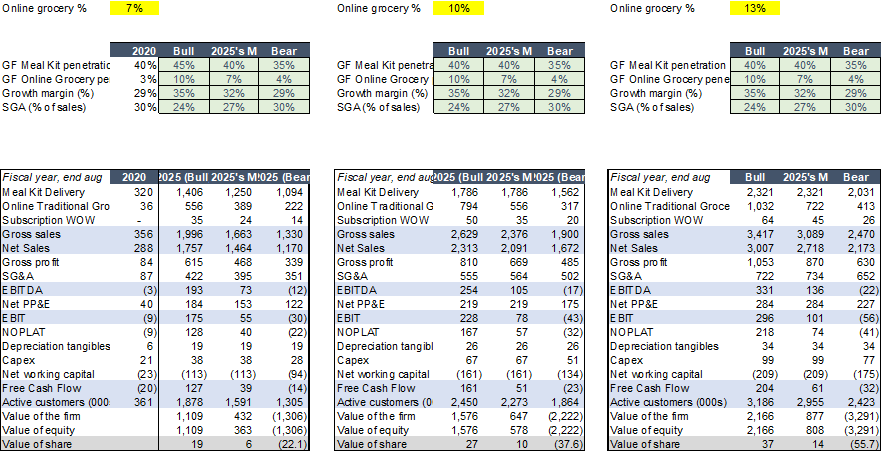
A bull, bear and Martin scenarios can be built around an assumption over the overall online grocery penetration within the canadian grocery market in 2025.
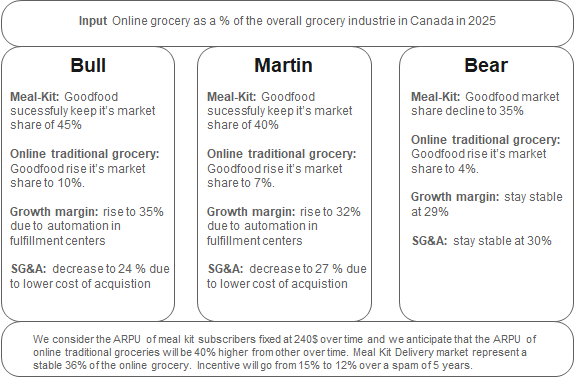
In 2019, online grocery represented 0.8% of the overall market and Goodfood had a market share of the meal kit segment of 40%. Meal Kit segment represented rougly 400M$ and, by deduction, online traditional grocery roughly 600M$.
We anticipate that in 2020, due to the pandemic, online grocery will represent 1.6 % of the overall market, keeping the same proportion between the two segments. Goodfood has a market share in the meal kit segment of 40% and 3% in the online tradional grocery, which represent 10% of its sales. Gross profit is 29% and SG&A 30%.
D. Challenges of the model
Below are the three main difficulty that I have to forecast Goodfood’s performance. Each variation of these variable has a important impact on the PV it’s stock price.
Cost of equity Goodfood has an actual beta of 0.3 , bringing it’s cost to equity to 2.08%. It does not seem sustainable. I used a beta closer to the market of 0.8
Net working capital Goodfood has a net working capital negative and it should remain negative for a long time . In fact, it’s core business of selling packaged fresh food make that the companies collect immediately cash from clients and pay supplier at n+60 + , as well as keeping a low inventory.
Reinvestment However, to grow, Goodfood will have to reinvest (in new fullfilment center, automation, etc.). Right now I have two way to calculate this reinvestment:
o Through CAPEX as : Ending Net PP&E – Beg net PP&PE + Depreciation. Gross PP&E is calculated as a factor of the number of box sold. As goodfood is primarly a box subscription business, we used historical data of sales and gross PP&E combined with our assumption of avg price by box. It’s the approach used in this model.
Ex: Goodfood sold $360M at an average prie of $90 per box, i.e 4M of box, with 45.5M of gross PP&E which give us a cost per box of 11.35$.o Through sales to capital ratio as: (REV year 2 – REV year 1) / sales to capital ratio. In 2020, Goodfood as 8.1M$ of invested capital (BV equity + BV debt – cash) bringing a ratio of sales to capital ratio of 38.29. On the opposite, based on Damodaran data, the retail (online) industry seems to have a ratio of 1.6
E. The model (Martin’ scenario at 10% online grocery penetration)
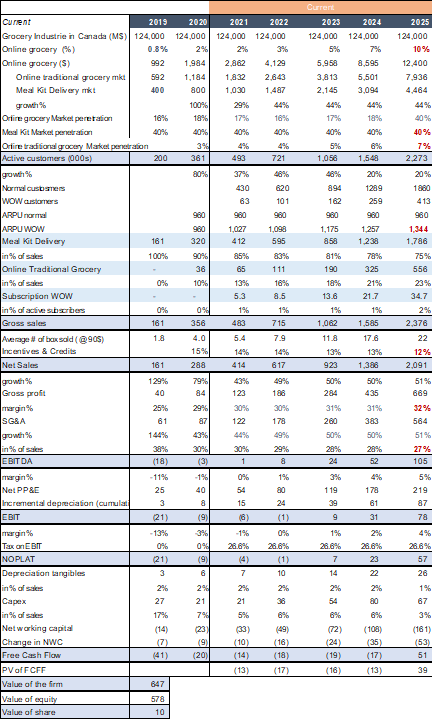
F. Sensitivy Analysis: Goodfood potential trajectory during next 5 years
Excel file can be download on Github here.
